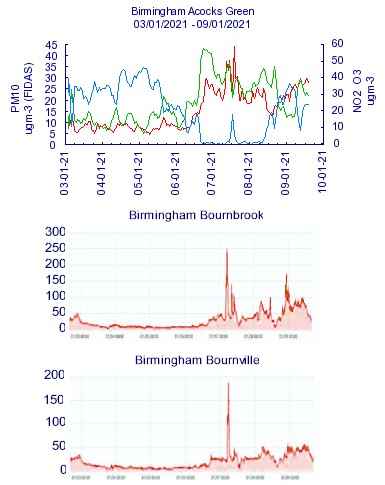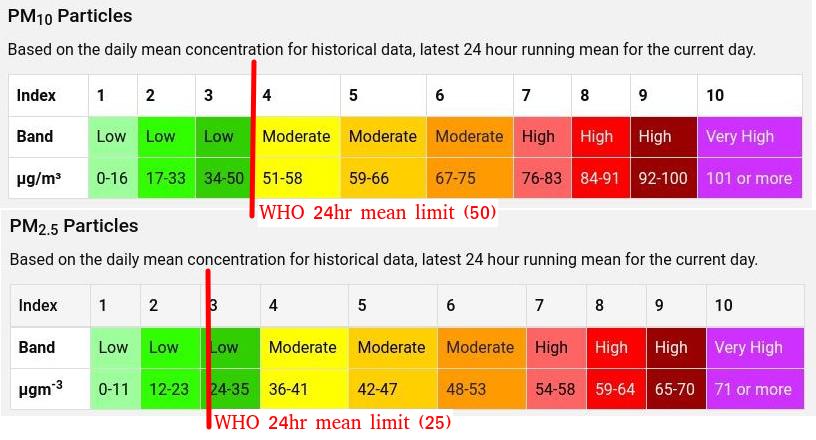
Birmingham City Council has seven NO₂ sensors across Birmingham, whilst DEFRA has three combination sensors. The DEFRA sensors can be monitored using Google Earth. Instantaneous levels are given for PM2.5 and PM10 particulates, ozone, and NO₂. PM10, ozone, and NO₂ are graphed, but not PM2.5. The DEFRA sensors show a degree of agreement with the citizen science sensors for PM10, in that the shape of the graphs is similar, but the absolute reading is not necessarily the same. Of course even identical sensors in different locations will show a different absolute reading. However, the DEFRA banding (low to very high) is very much out of step with the limits recommended by the World Health Organisation (WHO).
| Comparison of the PM10 results (in red) from a DEFRA sensor with two citizen science sensors | DEFRA 24 hour mean bands compared with the limits recommended by the WHO |
|---|---|
 |
 |
DEFRA appear to be graphing the instantaneous levels, but both DEFRA and the WHO (very reasonably) refer to 24 hour means with regard to how poor is the air quality. 24 hour rolling means are plotted over a week for the citizen science science sensors, as shown below for Bournbrook.


